
Plot Multi-Simulator Comparative Metric Heatmap Across Canonical Categories
Source:R/10_visualizations.R
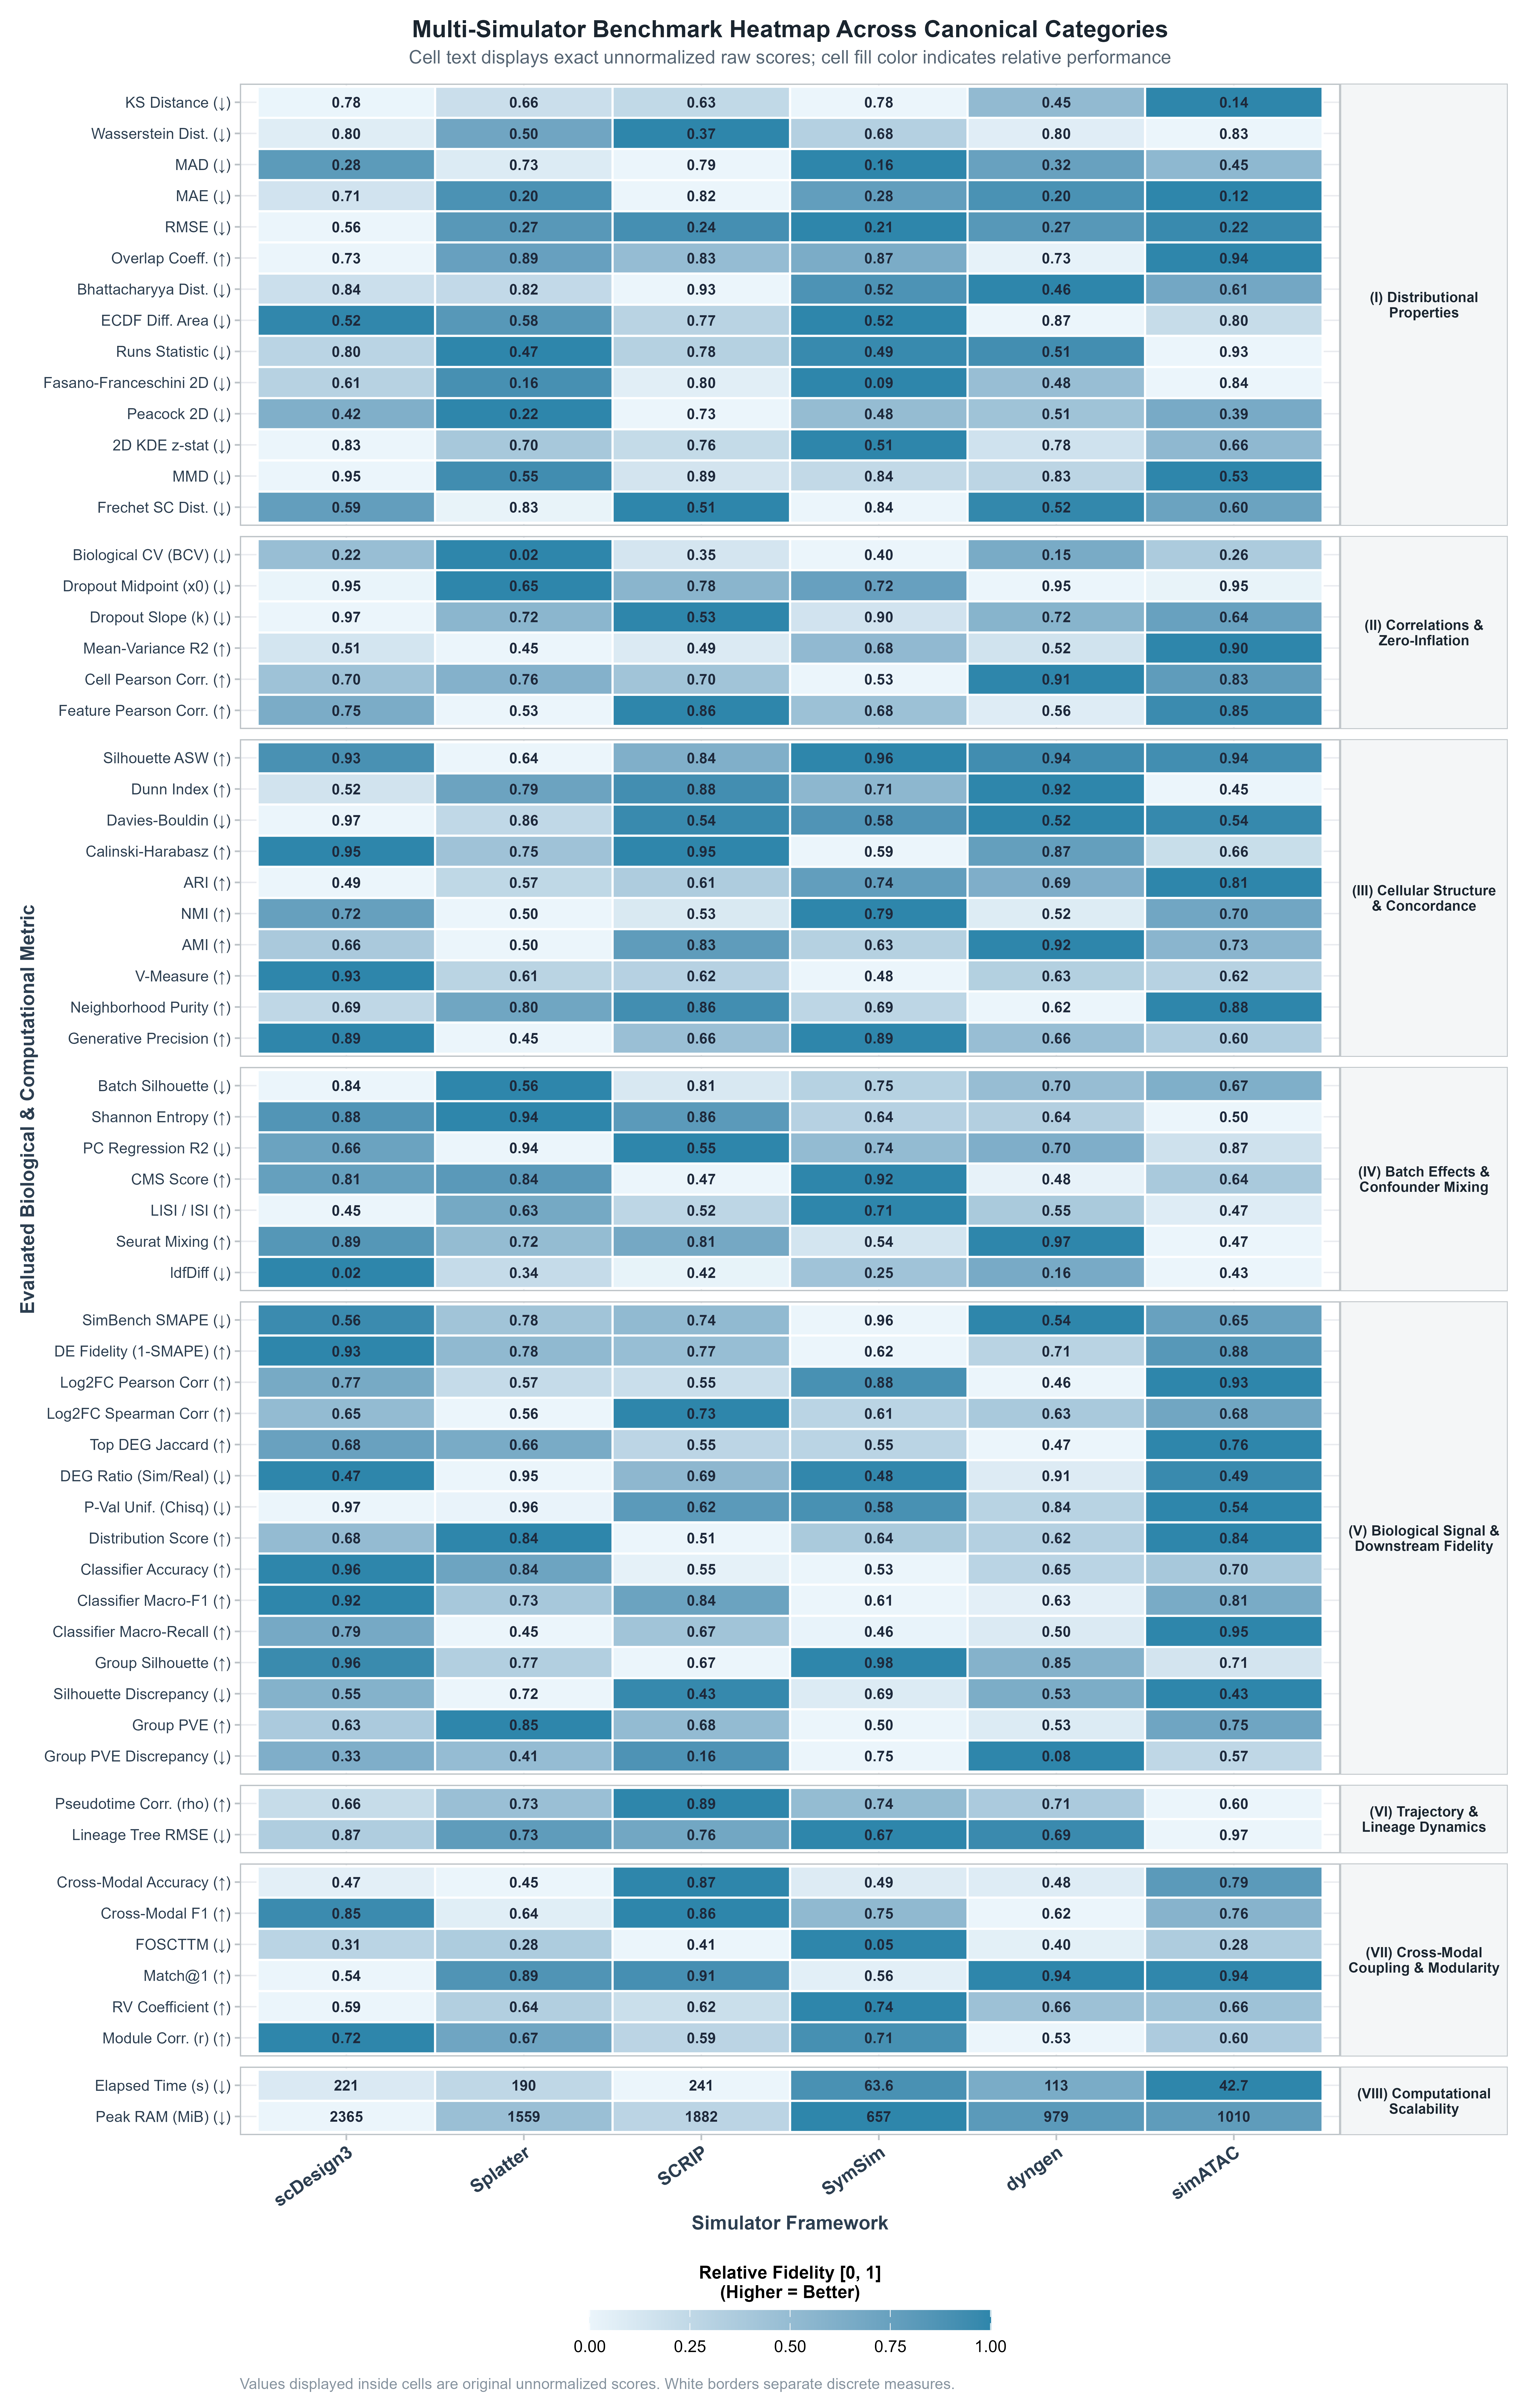
plot_metric_heatmap.RdProduces a 600 DPI comparative heatmap displaying simulators on the x-axis and evaluated biological/computational measures on the y-axis, grouped by the 8 canonical evaluation categories. Displays the exact original raw evaluation score in text inside every cell, with cell fill colors scaled by relative fidelity (direction-aware, ensuring balanced visual contrast across all 62 measures without scale distortion from high-magnitude metrics like RAM or runtime).
Usage
plot_metric_heatmap(
  benchmark_data,
  category = NULL,
  metrics = NULL,
  scale_fill = c("relative", "raw"),
  top_n_properties = NULL,
  facet_by_category = TRUE,
  cluster_rows = FALSE,
  cluster_cols = FALSE,
  base_size = 10,
  metric_name = NULL
)
Arguments
- benchmark_data
A tidy benchmark summary table or a named list of benchmark tables.
- category
Optional character vector to filter by canonical evaluation category. Default
NULL(all 8 categories).- metrics
Optional character vector of specific metrics to include. Default
NULL(all).- scale_fill
Character. Cell color fill scaling:
"relative"(default; direction-aware min-max normalized fidelity in [0, 1] across methods per metric, ensuring balanced color contrast across all 62 measures while cell text displays exact raw numbers) or"raw"(direct numeric values).- top_n_properties
Optional integer. If specified, restricts to top N most variable metrics. Default
NULL(all metrics).- facet_by_category
Logical. Whether to group rows into vertical category banner panels across all 8 categories. Default
TRUE.- cluster_rows
Logical. Hierarchically cluster measures along y-axis. Default
FALSE.- cluster_cols
Logical. Hierarchically cluster simulators along x-axis. Default
FALSE.- base_size
Numeric. Base font size. Default
10.- metric_name
Optional legacy alias for
metrics.
Examples
data(example_scrna, package = "scSimEval")
res <- evaluate_simulation_accuracy(example_scrna$ref, example_scrna$sim)
#> [1/5] Extracting cell-level properties...
#> [2/5] Extracting feature-level properties...
#> [3/5] Computing univariate accuracy metrics...
#> Metric: 'bhattacharyya' with unit: 'log'; comparing: 2 vectors
#> Metric: 'bhattacharyya' with unit: 'log'; comparing: 2 vectors
#> Metric: 'bhattacharyya' with unit: 'log'; comparing: 2 vectors
#> Metric: 'bhattacharyya' with unit: 'log'; comparing: 2 vectors
#> Metric: 'bhattacharyya' with unit: 'log'; comparing: 2 vectors
#> Metric: 'bhattacharyya' with unit: 'log'; comparing: 2 vectors
#> Metric: 'bhattacharyya' with unit: 'log'; comparing: 2 vectors
#> Metric: 'bhattacharyya' with unit: 'log'; comparing: 2 vectors
#> Metric: 'bhattacharyya' with unit: 'log'; comparing: 2 vectors
#> Metric: 'bhattacharyya' with unit: 'log'; comparing: 2 vectors
#> Metric: 'bhattacharyya' with unit: 'log'; comparing: 2 vectors
#> [4/5] Computing bivariate metrics (Fasano-Franceschini, Peacock, KDE zstat, 2D EMD)...
#> Warning: argument is not numeric or logical: returning NA
#> Warning: emd: Maximum number of iterations has been reached (500)
#> Warning: argument is not numeric or logical: returning NA
#> Warning: emd: Maximum number of iterations has been reached (500)
#> Warning: argument is not numeric or logical: returning NA
#> Warning: emd: Maximum number of iterations has been reached (500)
#> Warning: argument is not numeric or logical: returning NA
#> Warning: emd: Maximum number of iterations has been reached (500)
#> [5/5] Computing zero-probability and manifold distances...
#> Unimodal accuracy evaluation complete.